How the latest enhancements to B.I.R.D. Tab™ make bird strike reporting simple and effective
| Company | Scarecrow – a robin company |
|---|---|
| Date | 13.11.2018 |
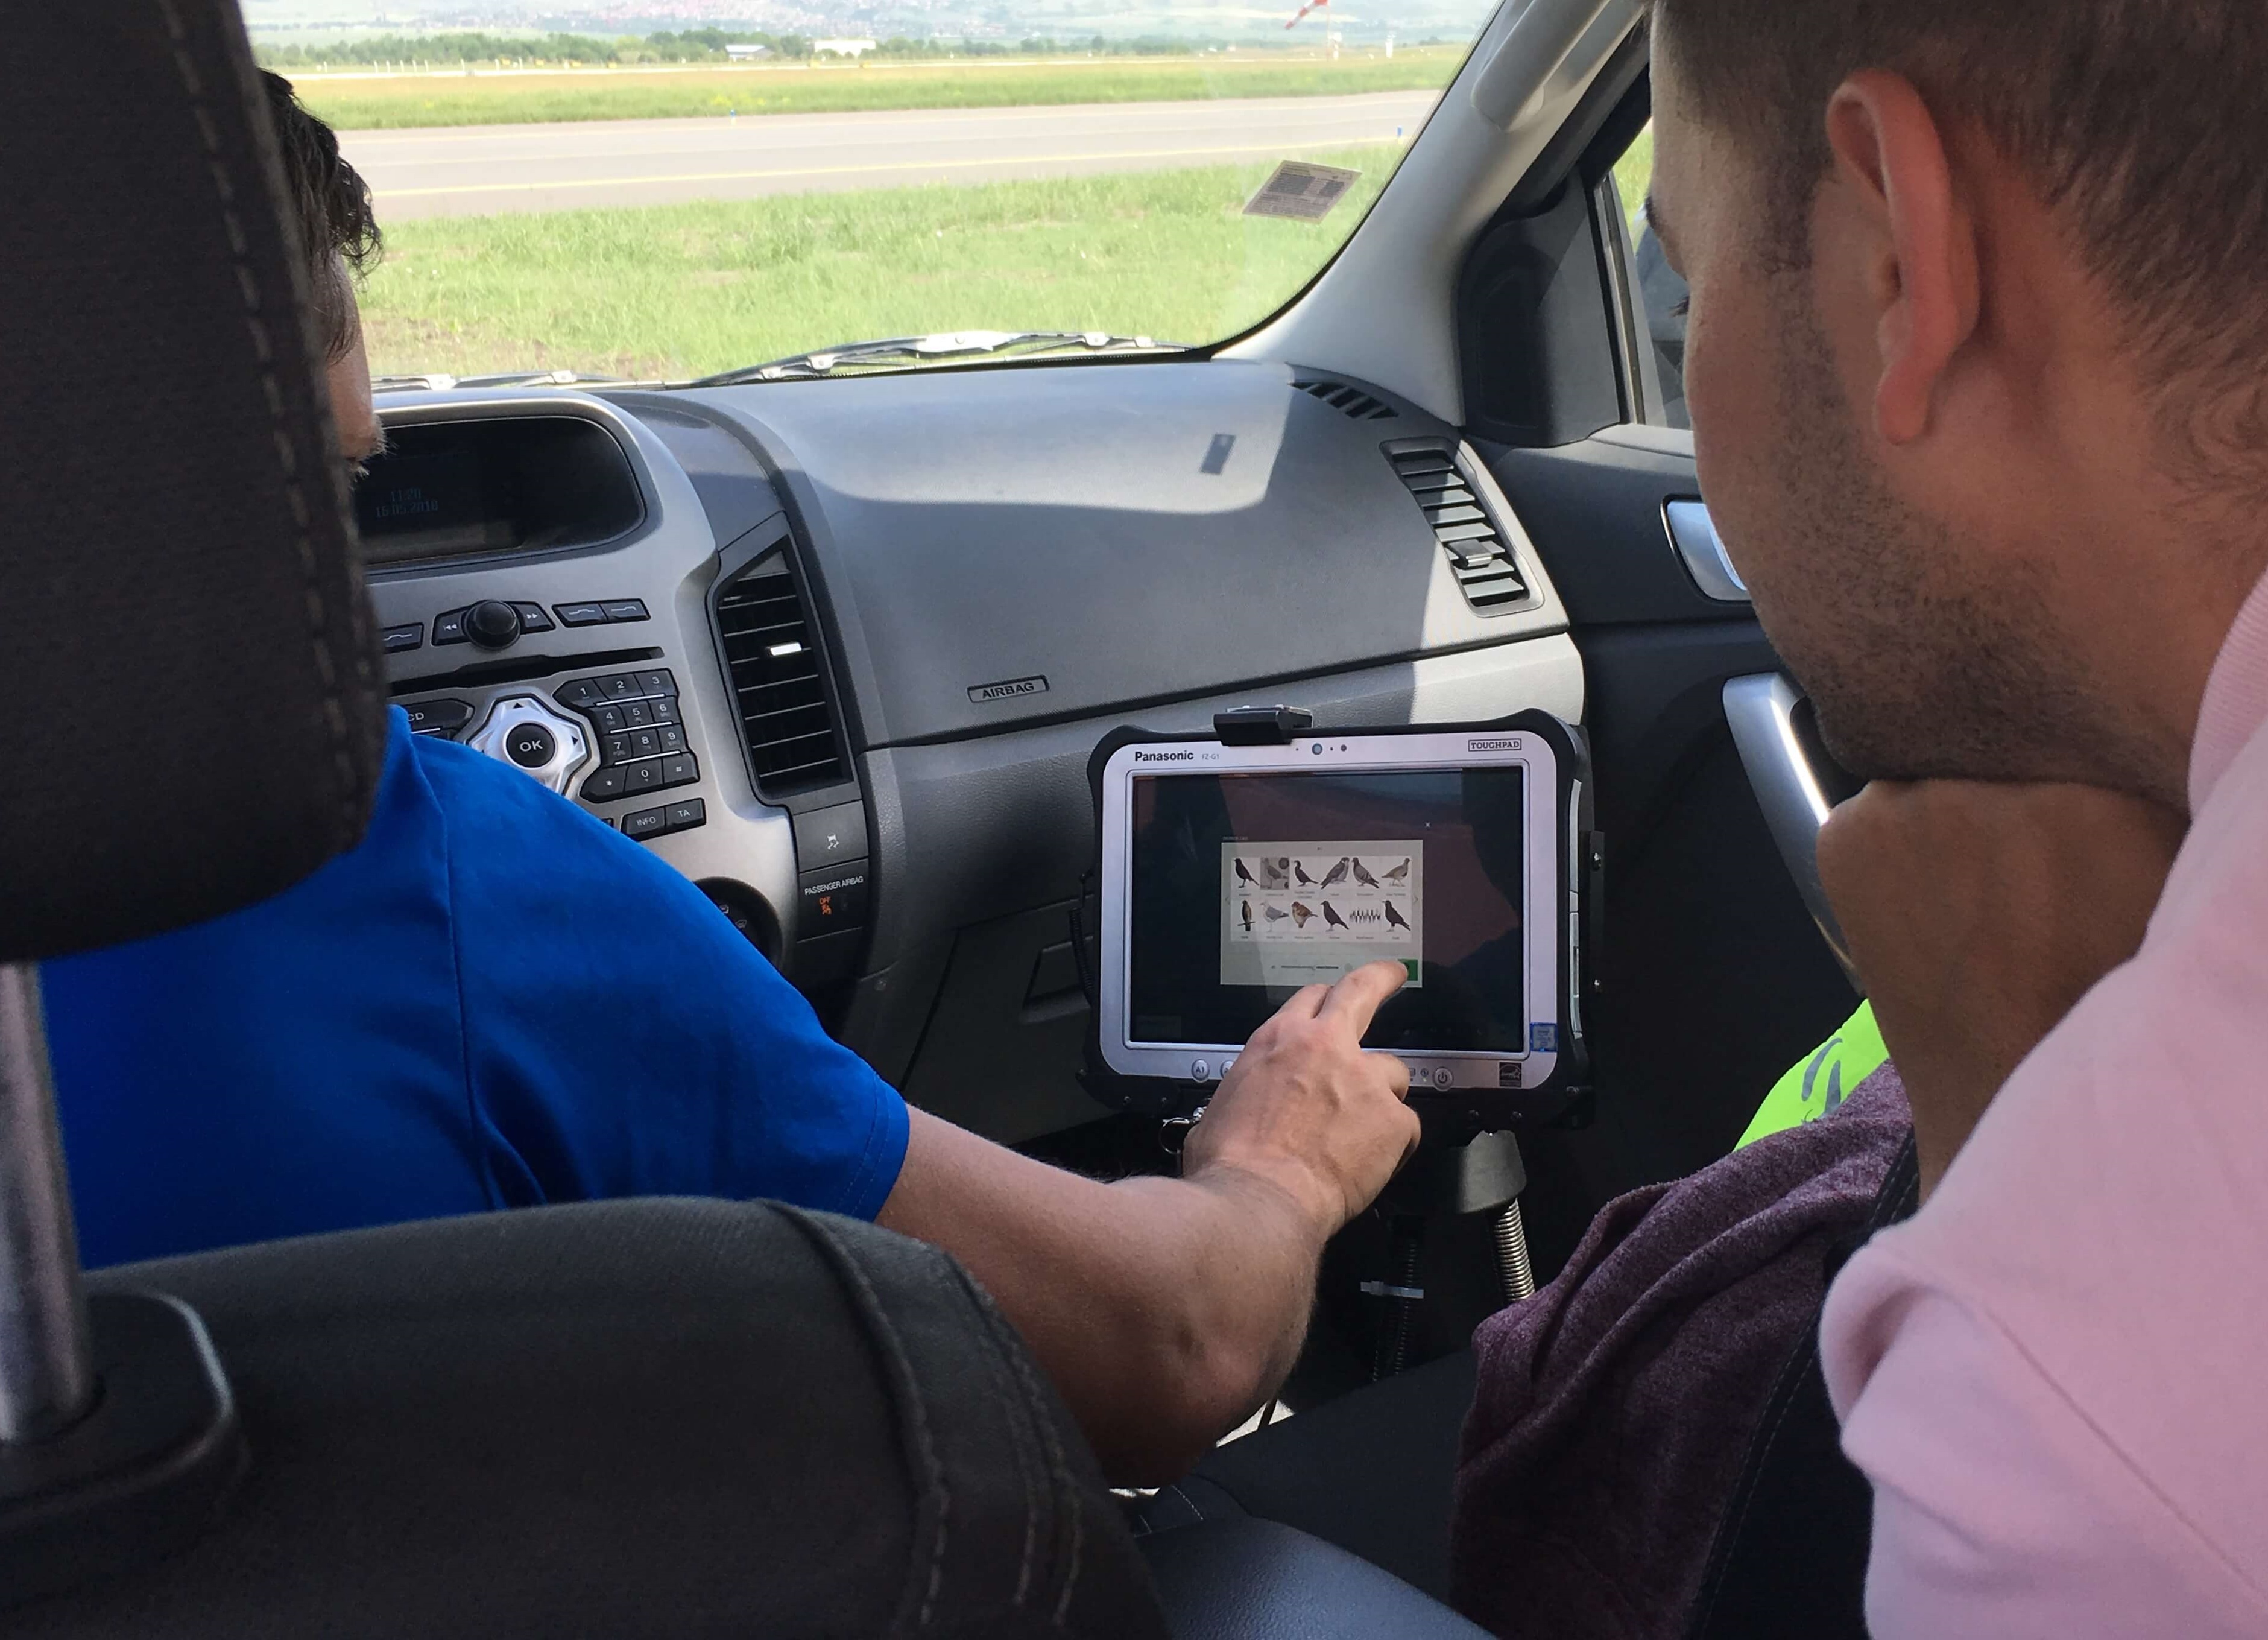
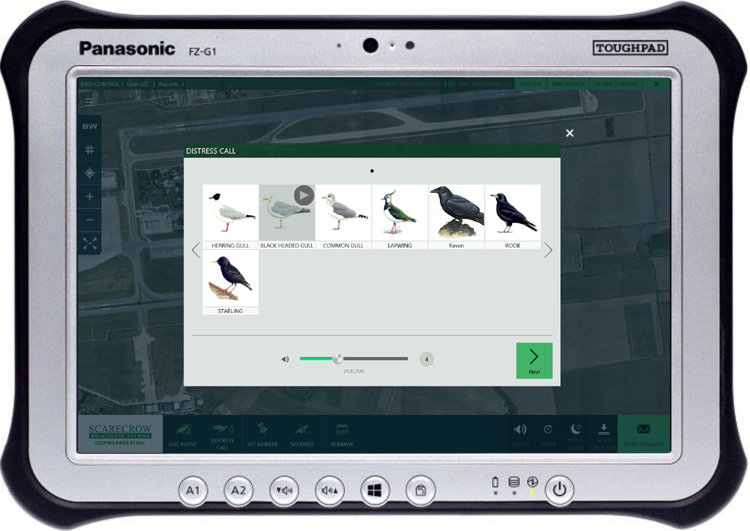 Scarecrow’s B.I.R.D. Tab™ system offers airports two very powerful bird management tools in one.
Our portable and highly-effective bird dispersal solution is accompanied by a powerful data logging and reporting software, giving distinct safety advantages over other solutions coming to market which consist solely of software packages..
The B.I.R.D. Tab solution allows airports to immediately deal with the threat of bird strike at airports whilst also gaining insight into ongoing ways to mitigate future risk. In doing so, it perfectly meets the changing bird management needs of modern airports.
And, with the latest enhancements our customers have requested, it now also addresses their increased reporting requirements.
B.I.R.D. TabTM (v1.9.5) makes it possible to generate reports for a number of stakeholders not only with ease, but exactly what you want, when you want – no need to wait for reports to be sent if there has been an incident or you need data fast.
All effective methods of bird control start with understanding
More than ever bird control at airports is about understanding as well as immediate action.
Long gone are the days when it was believed just throwing more dispersal tactics at this problem would do anything other than provide a temporary resolution. Increasingly, with habituation, some even fail to provide this.
Monitoring and reporting on bird behaviour is critical to reaching a level of understanding that can inform truly effective action.
Here’s how the International Civil Aviation Authority’s (ICAO) recently amended Standards and Recommended Practices now positions the centrality of the collection of data:
‘The presence of wildlife (birds and animals) on and in the vicinity of aerodromes poses a serious threat to aircraft operational safety.
[This should] be assessed through the collection of information from aircraft operators and aerodrome personnel, and an ongoing evaluation of the wildlife hazard by competent personnel.’
 B.I.R.D TabTM enhanced reporting features
Since 1984, we have developed and delivered the most sophisticated bird dispersal systems throughout the world. r B.I.R.D. TabTM software has helped airport bird control teams to identify, record and report on bird habitats and movements on and around the aerodrome. And we’ve just made the burden of reporting lighter still with our latest release of the software (V1.9.5).
Following consultation with our wide base of users we have introduced four major enhancements that make reporting on and sharing insights easier than ever before.
Here are four ways that B.I.R.D TabTM software makes it easier to monitor and report on airside bird activity.
- Improved ‘aircraft movements versus bird strike (per 10K)’ reports
We’ve made it easier to generate the reports that you need the most.
For instance, in the latest release it’s now possible – at the click of a button – to generate an aircraft movement chart that will illustrate the bird strike rate per 10, 000 movements.
What’s more, you can now add in comparisons of your chosen period with others, such as last month or last year. This means that, at a glance, it’s now possible to determine the scale of change and use this insight to review the factors that are contributing to this.
- Personalised dashboards
With more complex data being recorded, and more people needing access to this data, you have told us that being able to quickly review the most important charts generated is vital.
This is why we’ve introduced a new dashboard that allows easy access to as many as six charts (or five charts and a map) from a single document.
In effect, this provides a quick and easy way to create top-level reviews of the core information that all stakeholders will need to refer to during operational meetings.
- More flexible comparisons
As the need to understand your data at a granular level increases you’ve asked for greater flexibility in the ‘consecutive options’ available for comparing current data with previous trends.
This allows more historical data points to be used to gain greater understanding of how a number of factors influence the current situation.
- Visualising data
With more stakeholders now reviewing bird movement and bird strike data there’s a greater need to visualise complex data in an accessible and easy-to-understand manner.
One of the best ways to do this is by representing such data visually: you’ll find horizontal and bar charts are now standard across all data sets used in our reporting software. You can also now create line and multiple line graphs against a much wider range of factors. Charts showing the Number of Events over time can be supplemented by charts detailing Wildlife Volume, Average Wildlife Volume per Event, Used Ammunition and Killed Volume.
B.I.R.D. TabTM: an operational, reporting and management tool
Bird strike is no longer an operational concern alone.
And nor is it just a matter of data collection and reporting.
The risk of bird strike is part of an airport’s risk management strategy, just like fire and security.
And we are committed to ensuring you have the management, reporting and operational tools that you need.
Contact
The Old Dairy, Straight Half Mile
Maresfield
East Sussex
United Kingdom
TN22 2HH
- +44 (0) 1825 766 363